|
异常子宫出血大鼠模型的构建与评价
|
连辉 1, 姜艳玲 1, 刘佳 1, 张玉立 2, 谢伟 2, 薛晓鸥 2, 李健 1(  )(  )
|
|
Construction and Evaluation of a Rat Model of Abnormal Uterine Bleeding
|
LIAN Hui 1, JIANG Yanling 1, LIU Jia 1, ZHANG Yuli 2, XIE Wei 2, XUE Xiaoou 2, LI Jian 1( )( )
|
|
|
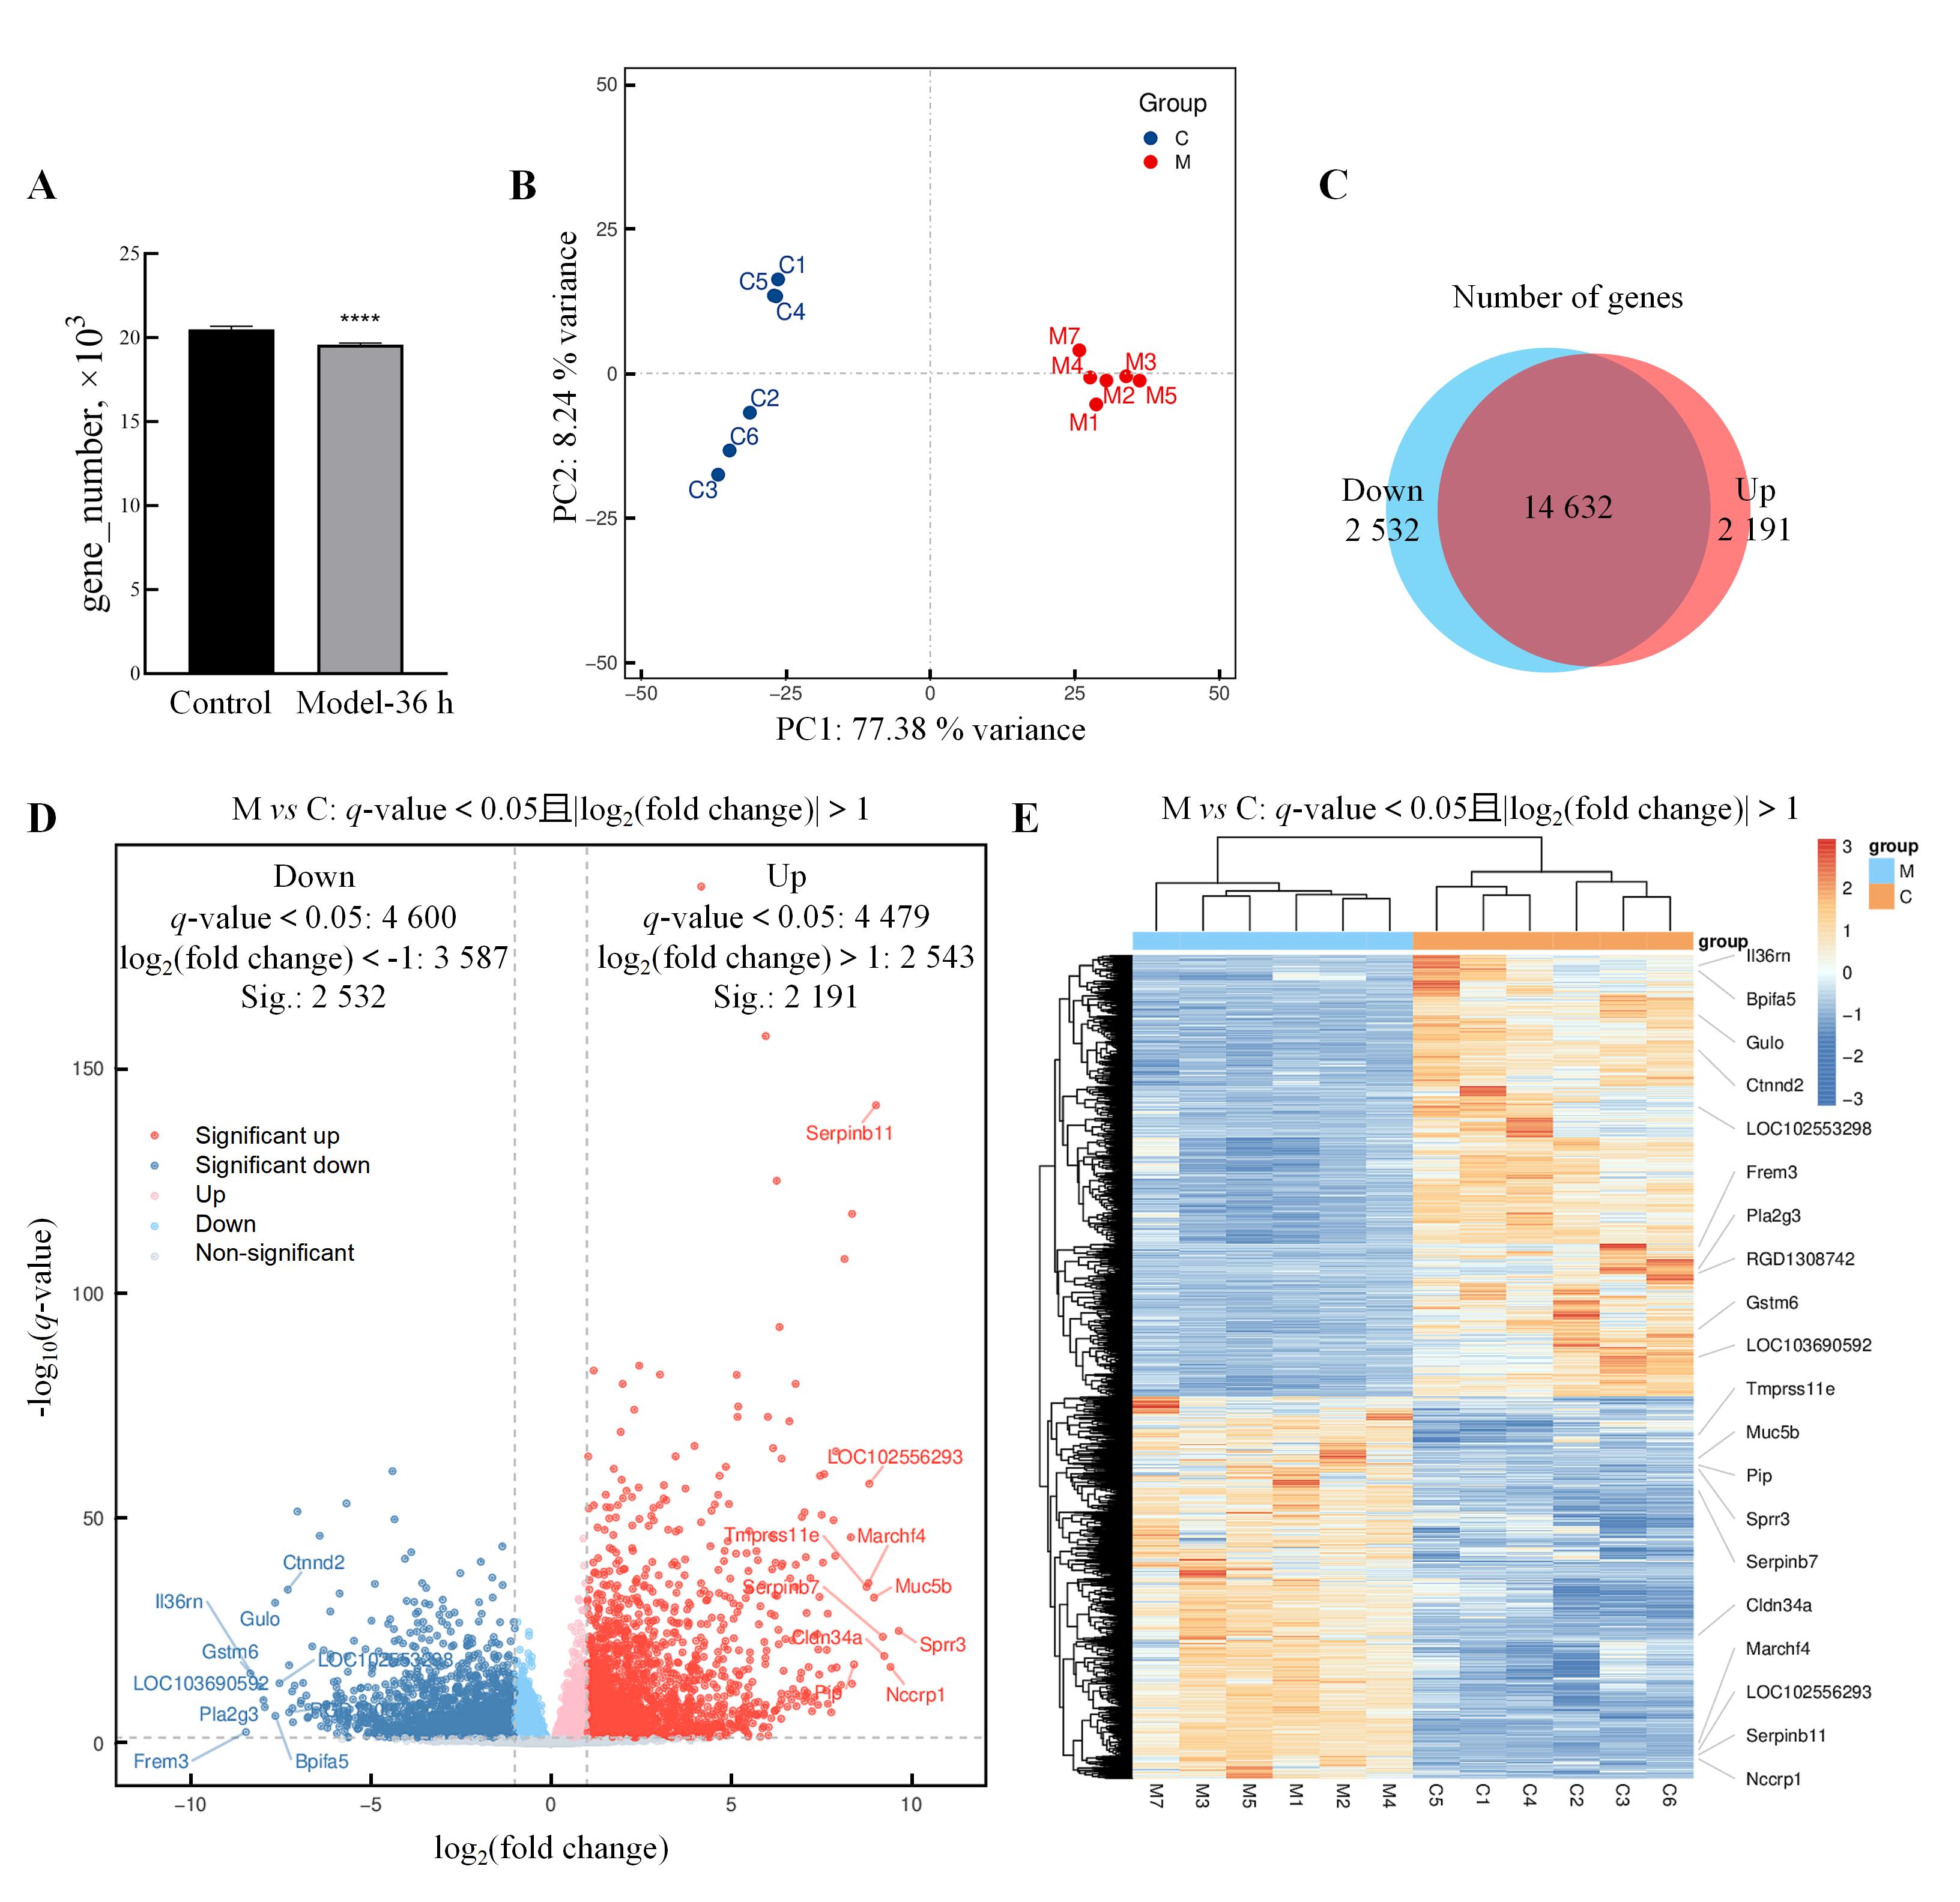
图 5. 异常子宫出血模型大鼠子宫组织中差异表达基因的转录组学分析
注:A,转录组学测序正常对照大鼠和异常子宫出血模型大鼠孕激素撤退36 h(Model-36 h)样本的基因数目(与正常对照组比较,****P<0.000 1);B,主成分分析结果;C,两组间表达基因差异的Venn图[图中蓝色区域表示Model-36 h相比正常对照组表达显著降低(Down)的基因集合,红色区域表示Model-36 h相比正常对照组表达显著升高(Up)的基因集合];D,差异表达基因分布火山图(下调差异表达基因中符合差异倍数筛选条件的用蓝色表示,不符合差异倍数筛选条件的用浅蓝色表示;上调差异表达基因中符合差异倍数筛选条件的用红色表示,不符合差异倍数筛选条件的用浅红色表示;差异不显著的表达基因用灰色表示。图中标注了部分差异倍数较高的下调和上调差异表达基因);E,差异表达基因分组聚类热图,图中颜色深浅代表数据点的数值高低(根据相似性进行分组聚类,图中标注了差异倍数较高的上调和下调基因)。
|
Figure 5. Transcriptomic analysis of differentially expressed genes in uterine tissue of abnormal uterine bleedingmodel rats
Note: A, The number of genes in rat samples from the normal control rats and the AUB model rats at 36 h after progesterone withdrawal (Model-36 h)(compared with normal control group, ****P<0.000 1); B, Results of principal component analysis; C, Venn diagram showing the differences in expressed genes between the two groups [The blue area represents the gene set with significantly decreased expression (Down) in the Model-36 h compared to normal control group, while the red area represents the gene set with significantly increased expression (Up) in the Model-36 h compared to normal control group]; D, Volcano plot of differentially expressed genes (down-regulated differentially expressed genes meeting fold change criteria in blue, non-meeting fold change criteria in light blue; up-regulated differentially expressed genes meeting criteria in red, non-meeting criteria in light red; non-significantly expressed genes in gray. The plot labels some of the differentially expressed genes with higher fold changes, including both down-regulated and up-regulated ones); E, Differentially expressed gene clustering heatmap by group, where the intensity of color represents the value of data points (grouping and clustering are based on similarity, and genes with higher fold changes in up-regulation and down-regulation are labeled in the heatmap).
|
|
 |
|
|